Australias Greenhouse Gas Emissions Highest on Record
Australia’s greenhouse gas emissions highest on record
The Paris Climate Agreement of December 2015, to which Australia is a signatory, has the goal of limiting climate warming this century by 2oC and to pursue efforts to limit the increase to a lower target of 1.5oC.
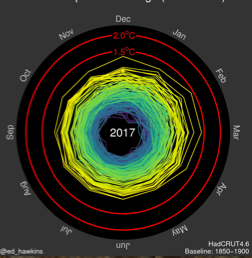
So how are we going? As the spiral of monthly values since 1850 indicates, we went very close to 1.5oC in 2016 (1.36oC to be precise). This was enhanced from the pure climate change signal by the natural contribution from an El Nino warming event. By the end of 2017 the El Nino was gone and December still managed to be the second warmest year on record.
Monthly temperature anomalies from 1850-2017. The cooler colours go up to 1940, the light green from 1940-1980, the yellows since 1980, and the dot indicates the last month of record, December 2017. The original data and an animation of the whole period are at https://blogs.reading.ac.uk/climate-lab-book/files/2016/06/spiral_2017_large-1.gif
Clearly, achieving 1.5oC will be near to impossible, especially given the tardiness of the Australian and other governments in moving towards even staying within the 2oC limit. As the headline since Paris says we have continued up to the highest greenhouse emissions on record.
Why is this important? Let’s take a few examples of importance to our life on the Peninsula.
Heat Stress: Heat stress on animals (including humans) arises from a combination of high temperatures and high humidity, both of which are increasing in many areas with climate warming:
- The fraction of land where the previously record observed historical summer temperatures are broken in any year is at 50-60% for 1.5oC and 70-80% for 2oC (Sanderson et al 2017)
- At 2oC our capacity for outside work decreases by 30% (as defined by safe working regulations) and this decrease accelerates rapidly beyond 2oC (Dunn et al 2013).
The following schematic indicates why relatively small changes in the mean have such a dramatic impact on the extremes. The left hand curve represents the probability of occurrences across an observed temperature range, with the extremes indicated. As shown in the right hand panel, a small shift towards higher temperatures results in previous high temperature records being commonplace as a whole new range of temperature extremes emerges. These graphs are for temperature, but they could equally be applied to any phenomenon with this general bell-shaped distribution – rain, drought, etc.
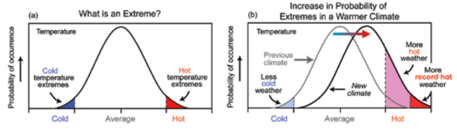
An illustrative example of the marked changes in extreme temperatures that can accompany relative small changes in the overall population (https://downloads.globalchange.gov/sap/sap3-3/sap3-3-final-all.pdf.).
Drought impact increases with climate change through two major processes: increased frequency of successive hot and dry periods, and more rapid drying of vegetation due to the overall warmer conditions (IPCC). The result is that southern Australia is already experiencing significant drying and warming, which is expected to continue. This is reflected also in an increasing proportion of land that is under severe drought in any one year (Lehner et al 2017).
Case Study 1 – Wine Production: Thus far climate change has been good for our iconic Peninsula grape, the Pinot Noir. Increasing temperatures and drier soil conditions have resulted in faster ripening with harvest now occurring over two weeks earlier than 30 years ago (Webb et al 2012). Webb also tells us that this has led to a more consistent and better quality crop. However, continued warming takes us out of this comfort zone and growers within traditional vineyard areas in southern Australia are already either purchasing alternative sites in suitable locations or considering different varietals as a protective measure.
Case Study 2 – Fauna and Flora: Trees and shrubs take decades to centuries to migrate to counter climatic changes, but our climate is adjusting much faster than they can do this. In special cases, large stands may be able to make their own microclimate and withstand a harsher external climate (as has happened with Californian redwoods), but they remain vulnerable to a single fire or other mishap.
As found by recent backyard bird surveys by Birdlife Australia and reported by long-term residents, we are seeing the migration of new animal species into the Peninsula. Galahs arrived 50-odd years ago followed more recently by the crested pigeons (Ocyphaps lophotes) – both are now common. Until recently little corellas (Cacatua sanguinea) were non-existent, now they are expanding across the Peninsula. And this year saw the first widespread sightings of scarlet honeyeaters (Myzomela sanguinolenta). These movements are no doubt due to a range of environmental factors of which climate change is a significant component. Unfortunately, other resident species may be forced to move elsewhere or may become extinct if they cannot do so.
The message is that our environment is changing with a rapidity that makes it difficult both us and the environment to adapt. The longer we and our government procrastinate, the harder and more expensive it gets.
- Article by Greg Holland. Images as indicated
References (available from Greg Holland):
- Dunn, J.P., R.J. Stouffer, and J.G. John, 2013: Reductions in labour capacity from heat stress under climate warming. Nature. Clim. Change, 3, 564-566. DOI: 10.1038/nclimate1827.
- Lehner, W.G. Strand, L. Lin, R. Knutti, and J.F. Lamarque, 2017: Community climate simulations to assess avoided impacts in 1.5 and 2 C futures. Earth Syst. Dynam., 8, 827–847, doi.org/10.5194/esd-8-827-2017.
- Sanderson, B.M., Y. Xu, C. Tebaldi, M. Wehner, B. O’Neill, A. Jahn, A.G. Pendergrass, F. Lehner, W.G. Strand, L. Lin, R. Knutti, and J.F. Lamarque, 2017: Community climate simulations to assess avoided impacts in 1.5°C and 2°C futures. Earth Sys. Dyn. (In Press).